RMI Plug-in for Eclipse
version 2.0
 The RMI Spy
The RMI Spy will show you what's really happening inside your RMI application and it complements the Registry Inspector that displays information about the objects in the registry. In particular the RMI Spy can:
- Show all outgoing (client) method calls
- Show all incoming (server) method calls
- Show all the classloading that takes place during an RMI method call.
- * Measure the execution time of both incoming and outgoing calls (no more manual calls to System.currentTimeMillis()! )
- * Measure the number of bytes transferred during each calls, with a "by argument" breakdown. Serialization costs are finally revealed!
- * Highlight method calls according to the above parameters.
- * Display the actual values sent to a remote method or returned from it.
- Show a complete call stack for each logged event.
(Features marked by "*" require JDK 1.5.0)
About the RMI Spy
As you can see, the RMI Spy is a very useful feature when debugging Java RMI applications. In it's simplest use the RMI Spy records all loggable RMI activity of a Java application and displays it in the RMI Spy view. For each RMI event it can show its complete context, including the timestamp, thread name and a complete stack trace of the event.
The RMI Spy is implemented using local TCP/IP communication with the RMI application and a small piece of the RMI Plug-in code runs inside your java application and communicates with the Eclipse IDE. This little piece of code is mostly harmless, but it can affect your application in certain ways. The following page details all possible side effects of using the RMI Spy.
Using the RMI Spy
|
In order to enable the RMI Spy, open an existing RMI Launch configuration or create a new configuration (Use the Run->Run... command). Go to the "RMI Launch" tab and check the "Enable RMI Spy" option. The RMI Spy will be enabled for both "run" and "debug" modes and will record at most 20,000 events. Read on about
TIP: In order to prevent the console view from showing each time there is some activity on the console, open the workbench preferences, expand the "Run/Debug" category and go to the "Console" category. Then uncheck the options that say "Show when program writes to ....". See Eclipse Console preferences for more information. |
) (click to enlarge) ) (click to enlarge) |
Switching between processes
When you're using the "Debug" perspective, the RMI Spy view will display information according to the process that is selected in the "Debug" view. You can also use the view menu (the spy icon) to display spy information about a particular process. When the process is removed from the "Debug" view, it's spy information is also removed.
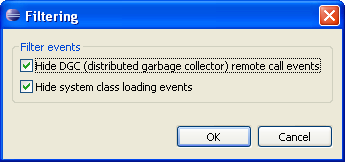
System events
Some events in the RMI system are related
to a system-level activity, such as the distributed garbage
collector (DGC), loading system classes, etc. These events are usually
not very interesting from the developer's perspective and by
default they filtered out. To change the filtering setting, open the filtering dialog box (by pressing the ![]() button on the view's toolbar):
button on the view's toolbar):
The events counters (on the bottom of the view) will tell you how many events are actually shown out of how many events (incl. system events) there were recorded.
© 2002-18 Genady Beryozkin, rmi-info@genady.net. Read our Privacy policy. Hosted on RimuHosting. Visit Javalobby.